
|
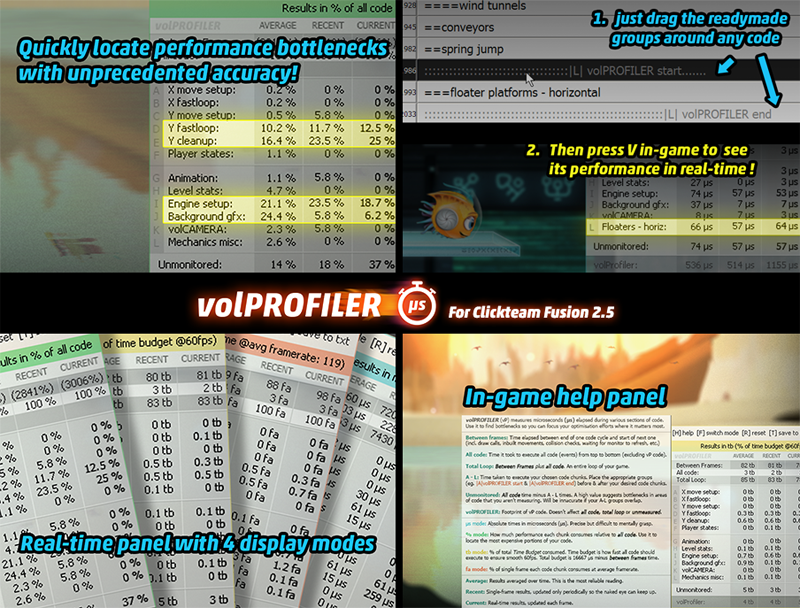
I'm cramming as much eye candy and mechanical nuance into Spryke as I can, to make it as impressive and satisfying to play as it can possibly be. That means that I push the Clickteam Fusion 2.5 engine pretty hard. Overall, the old girl copes pretty well with what I throw at her, but I'm still taking optimising very seriously, to make sure that Spryke runs smoothly on as many PC setups as possible. A while ago, I wrote a post describing some of my optimisation efforts. A very helpful commenter pointed out that I really shouldn't be blindly optimising everything I can, but should be profiling the code to find the bottlenecks, and then devote my energy optimising those. It was very good advice. The trouble is that Fusion doesn't have any kind of native profiler built-in. And cobbling together one's own was more or less impossible because Fusion didn't provide the means to measure code time finely enough. Well, it's a few weeks later, and I'm now pleased to say that I've gotten around these problems, and have built Fusion's first ever code profiler that can accurately measure code performance in microseconds! I'm sure it's not as full-featured as the profilers that come with 'real' programming environments like Visual Studio, and it only measures the performance of your Fusion code (not, for example, the DirectX & GPU side of things). But it's still pretty damn useful, if I do say so myself. It's called volPROFILER, and the Clickteam developers among you can get it on the Clickstore for just $2.99.  volPROFILER in action in Spryke BackgroundUntil now, it's been impossible to measure the processing times of Fusion events with any meaningful accuracy. The timer object measures only in milliseconds, and can only measure between one frame and the next, not inside the frame. The Date & Time object can measure inside the frame, but only in hundredths of a second. Both methods are much too coarse to be useful for performance profiling. To achieve 60fps, your game must average less than 16.7 milliseconds per frame. That includes not just code, but draw calls, DirectX stuff, clickteam movements, animation processing, Fusion's overhead, OS overhead etc. Therefore your code needs to take much less than 16.7ms to execute - perhaps less than half of that. And since your code is probably comprised of many components (movement, enemy AI, input, audio, HUD, etc.) you'll want most or all of those components to fall well below 1ms each. So trying to measure some small portion of your code using the timer (1ms accuracy) would be near-useless even if it let you measure within the frame (it doesn't). Using the date & time object (10ms accuracy) wouldn't even come close. To solve this problem, I specially commissioned the famous Looki (well known in Clickteam circles - but even if you haven't heard the name before, there's a good chance you already use some of his shaders or extensions) to build a timer object that's capable of measuring in microseconds (millionths of a second, or μs), within the frame. This object is called Microtimer, and I'm making it freely available to everyone - it will hopefully be findable in the Clickteam Fusion 2.5 extension manager by the time you read this (if not, get it here). You can quite easily use it to build an in-game timer that measures bits of your code. But if you would like a comprehensive, carefully-designed and user-friendly profiler, and want to save yourself a few days' work (and help me offset the cost of commissioning the microtimer) then you can get the solution I've built, volPROFILER, for 2.99 on the Clickstore. volPROFILER Features
0 Comments
Leave a Reply. |
|

 RSS Feed